THE ILLINOIS REMI MODEL: IMPORTANT ASPECTS TO A USER
THE ILLINOIS REMI MODEL: IMPORTANT ASPECTS TO A USER
Mark A. Bonardelli
Strategic Planning Section
Illinois Department of Energy and Natural Resources
325 West Adams Street, suite 300,
Springfield, Illinois 62704-1892
ABSTRACT
The REMI forecasting and simulation model is a dynamic general equilibrium model of a state, region, or any sub-national economy of the United States. There are many aspects of the model which aid the user in performing various types of analysis, whether it is for forecasting or impact assessment.
Four features of the REMI modeling system will be demonstrated in the paper. The first feature is the availability of a U.S. forecast that can be used in conjunction with the state or regional model. Since the model is calibrated to national data, a national model is created and is used as the "driver" of the state model. Therefore, an event that is national in scope, such as a $10 increase in the price of crude oil, can be modeled in the U.S. model. These changes at the national level work their way to the state economy creating a new state control forecast.
Selecting the variables for input into the REMI model is probably the most important task in using the model. Sometimes no REMI variable exists for the particular scenario that the analyst wishes to undertake. The analyst must then choose proxy variables to use for his analysis.
The REMI model has several "switches" for use if the analyst wishes to suspend generally accepted economic theory or model extraordinary events. A few examples are presented in the paper.
The fourth feature, an input-output table is also part of the REMI modeling system. If detailed information is available, use of the I-O table can increase precision of the analysis. An example of the use of the I-O table is presented in an example of lost coal sales and its effects on the Illinois economy.
INTRODUCTION
The purpose of this paper is to describe the REMI forecasting and simulation model, a powerful dynamic general equilibrium model, from the user's perspective. A brief description of the REMI model, derived from the model documentation, provides an overview from which specific aspects of the model will be discussed. The presentation will describe examples of actual uses to highlight some aspects of the REMI model to a potential user. However, these aspects of the model, even though discussed separately, must be taken into account when planning to use the model for a specific scenario or policy change.
The Illinois Department of Energy and Natural Resources has purchased two REMI models: a statewide model and a seven area sub-state model. Even though REMI models can represent a state or regional economy, data from all regions of the nation are used in creating the REMI model. Therefore, a state or regional model is consistent with national data and it is this aspect of the REMI modeling system that makes it flexible for the forecasting needs of the user. Since the national economy influences events in a regional economy, the REMI model uses the U.S. economy as the "driver" for the regional model. That means that changes at national level can be modeled and these national impacts work their way to the regional model thus deriving a new regional forecast. In addition, the user can update the U.S. model periodically using forecasts provided by national forecasting firms, until the newest update from REMI is available.
Selecting the variables for input into the REMI model is probably the most important task in using the model. When a project entails a change in the level of employment for an industry, the selection of the correct variable is quite simple. However, there are many cases where the simulation that is to be undertaken does not translate well into variables that are available for use in the REMI model. Proxy variables must be selected to use in place of the variables in a particular scenario that are not available in the REMI model. An analyst must know how he expects a scenario will impact the economy. With that knowledge, REMI variables can be chosen that approximate how a scenario works through the economy. This approach is illustrated to estimate the impacts of the construction and operation of a gaming complex in the state.
A scenario to be analysed may have several different phases and it may be important to separate the short term effects from the long term effects. There are several "switches" in the model that give the user control on how the economy will operate. This approach is invaluable if a user has exogenous information on how certain aspects of the simulation will work through his region. A brief look at some of the "switches" and what they do is included in description of a two-part simulation of the construction and operation of an auto plant.
An input-output table, which provides a snapshot of the interrelations in the economy at a point in time is also part of the REMI system. If detailed data is available to the analyst, then the use of the I-O model adds precision to the impact analysis. An example of the use of the I-O model is illustrated in an example of lost coal sales and its effects on the Illinois economy.
DESCRIPTION OF THE REMI MODEL
The REMI model is a dynamic general equilibrium model of the Illinois economy and its sub-regions. The model used in the subsequent analysis of lost coal sales divides the state into seven sub-regions. According to the REMI manual, the structure of the model incorporates inter-industry transactions as well as behavioral equations from economic theory. This approach allows for detailed data to be incorporated into the model and allows the model to respond to policy-initiated changes. The REMI model therefore replicates the sub-national economy that predicts supply and demand conditions across 53 sectors, 94 occupations, 25 final demand sectors, and 202 age/sex cohorts.
In contrast to traditional regional models, the REMI model is estimated using data from all regions and then calibrated to a specific region. This method allows model parameters to be estimated using a large data set that produces more econometrically reliable results than would be possible using data from a smaller area. Other features include a Cobb-Douglas production function which allows for substitution among factors, along with the ability to track migration changes in response to income fluctuations, wage responses to changes in labor market conditions, and changes in the share of local and export markets in response to regional production costs.
The REMI model generates a forecast by solving for the equilibrium values in the labor, goods, and other markets of the economy for every year of the forecast. This dynamic approach is used to clear the markets instead of the traditional approach in regional models of using econometric estimates based on time-series observations for each region. Therefore, the REMI model is not an econometric model although some coefficients are determined econometrically for use in the clearing of the markets over the forecast time period.
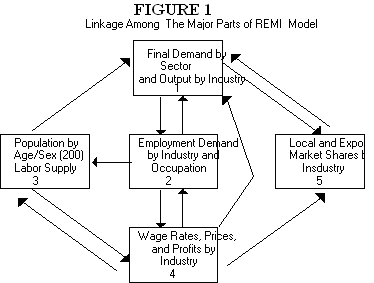
The model can be summarized without the use of the many equations that are contained in the model. Five major components can be segregated in the REMI model:
1. final demand and output
2. labor and capital demand
3. population and labor supply
4. wages, prices, and profits
5. market shares.
As one would expect, each component is interrelated with each other. From Figure 1, one sees that the output component (1), the core of the model, drives labor demand (2). Labor demand interacts with the supply of labor (3) to determine the wage rate. Wages, along with the costs of the other factors of production, determine relative production costs and profitability (4). The relative costs thereby affect market shares (5). The market shares are the proportions of local demand in the region and exogenous export demand that local production fulfills.
Consumption, investment, and state and local government demand derives final demand. Consumption itself is a function of real disposable income. An identity equation defines nominal disposable income as wage income from components 2 and 4, plus property income related to the population (3), plus transfer income related to population less employment and retirement population, minus taxes. Nominal disposable income is then deflated by the price index (4). The optimal capital stock (2) drives investment. Population (3) drives state and local government final demand.
An input-output table, which captures detailed inter-industry relationships, is part of the REMI modeling system and can be used if detailed input information is available to the analyst. The I-O table is derived from actual observed production and consumption data in the various sectors of the economy. The basic unit is a broadly defined industry or sector that is assumed to use both labor and the products of the other industries as inputs. These industries produce output for either input to other industries or for final consumption. The I-O table gives a picture of the interrelations that exist in the economy at a moment in time.
The use of the input-output table allows for more precision in the impacts of a simulation. The increased precision comes from the ability to stimulate sectors that are more specific than the two-digit Standard Industrial Classification (SIC) industries in the forecasting portion of the REMI model. Since it is likely that the characteristics of the more disaggregated industry are different that its two-digit SIC grouping, greater weight is given to the disaggregated industry within its two-digit SIC grouping. The input-output data is aggregated to the two-digit SIC level and is transferred to the forecasting portion of the REMI model in the form of wage adjustments and employment. With the data from the input-output table, the forecasting portion of the REMI model can extrapolate into the future from the detailed change in economic activity.
USING THE U.S. DRIVER WITH THE STATE MODEL
Every state or regional REMI model which is created, is calibrated to a national REMI model, as explained briefly above. Since the REMI model is created for the nation as a whole, this U.S. REMI model is used as an integral part of the sub-national model. Specifically, the U.S. REMI model can be used as a "driver" for the regional model. That means that a national event can be modeled in the U.S. model, and the impacts on the U.S. will then drive the regional model providing a new regional forecast. Subsequently, all new regional policy changes or impact analyses are done with the revised regional control forecast.
Suppose a change occurs in the national economy that is expected to become permanent. Then the analyst would require that the U.S. driver reflect this change, so that any regional analysis would reflect this national economic activity. The example presented here is an increase in the price of a barrel of crude oil by $10. This price change is experienced by all regions and states in various ways, depending both on the size of the oil industry and the level of consumption in the regional area.
The REMI policy variables for the U.S. model are the same as the ones that are used in the state model and there is no oil price policy variable in the model. Therefore, the analyst must choose a variable that will simulate the effects of an oil price increase. (The subject of variable selection will be dealt with in the next section.) The variable used as a proxy for an oil price increase of $10 per barrel was a tax policy variable. The rationale for using this variable is that a tax increase takes away income from consumers. Since Illinois is a small producer of crude oil, the money generated from a price increase leaves the state. Consumers now have less money to spend on their basket of goods.
Once the change to the U.S. model is made, the state model is re-run with the new U.S. driver. A new control forecast is created and, in this case, Illinois employment and income levels are reduced compared to the original control forecast. The accompanying tables (1 and 2) and figures (2 and 3) present data on the original and revised Illinois forecast.
One notices that, built into the control forecast, is a decline in economic activity for the years 1991 and 1992. Actual Illinois data, in real terms, indicate that economic activity was flat in 1991, while partial data for 1992 indicate some improvement. After 1992, the original control forecast shows a growing economy. The impact of a $10 per barrel increase to the national economy alters the original Illinois control forecast. The new Illinois control forecast indicates that the economy's path over time will be below the original control forecast. The potential of the Illinois economy has been reduced by a national event. Therefore, any scenarios or policy changes now imposed on the Illinois economy work through a smaller economic base.
With energy scenarios, many events occur at the national level. These national events then affect the state in a particular way. If an energy model specific to the state, like 2020, is used with the REMI model's forecast of this $10 per barrel increase, the state-specific impacts work through the Energy 2020 model, altering the supply mix of fuels that utilities choose.
HOW POLICY VARIABLES WORK THEIR WAY THROUGH THE MODEL
The most important procedure to the analyst is the selection of the policy variables to be input into the model. If the analyst is satisfied with the input variables used in a scenario, then he can be confident with the results of the REMI model. Therefore, understanding how a policy variable will work through the REMI model can aid in choosing the variables. This is especially true when there is no policy variable for a particular scenario and one must choose a proxy variable to use.
Two examples are presented here: the impacts of locating an auto plant in the state and the impacts of the construction and operation of a gaming facility. The selection of variables for the auto-plant was straight forward, but this impact analysis presents a case of two phases of a scenario: short term versus long term effects. The latter scenario presented a challenge in the selection of policy variables to approximate a new industry in Illinois.
The impacts of the Diamond Star auto plant in Illinois were estimated several years ago and provided information to the state on how to structure an incentive package to offer the plant owners. The scenario can be divided into two parts: the construction phase and the operations phase. The plant was to be built over a two year period and then auto production would begin in the third year.
For the construction phase, the industrial building construction expenditures policy variable was chosen from a group of policy variables labeled translator variables. These variables are "pre-made" policy variables that contain the amount of cents that each 2-digit SIC code contributes to $1 worth of the construction variable in question. The vector also includes the wages that are generated in the construction process.
If there is an increase in investment in an area, then it is expected that this investment will call forth additional capital formation. However, the construction phase of a project is a short term phenomenon and the analyst would not expect the occurrence of extensive investments in response to these short term expenditures. Therefore, the analyst can prevent increased economic activity due to a short term investment from occurring in the REMI model by changing a policy variable switch. There exist several other switches in the REMI model, discussed below, that allow the analyst to suspend intuitive economic theory. In this analysis of the Diamond Star plant, the switch to prevent subsequent endogenous investment due to the short term construction project is used. However, in the operations phase of the scenario where employment will be long term, the analyst would allow the endogenous investment changes from this phase of the project to work through the economy.
The employment changes from the operations phase of the Diamond Star plant can be traced through the economy. The stimulus of the employment variable can be explained through the summary diagram, Figure 1 above, or with Figure 4 or 5, which is a more detailed diagram. An employment change will affect initially wages, alter the capital stock level, and change a variable indicating the amount of high-paying jobs in a particular industry relative to the nation (REO).
Increasing wages from hiring auto workers increases real disposable income, but increases production costs relative to the nation. Labor intensity declines since wages are bid up due the increase in the demand for labor. The capital stock changes since capital goods are more attractive relative to labor. Since the price level has increased, the real wage rate has declined.
Tracing the movements of various variables in the model indicates which markets will be affected. If the policy variable chosen works its way through the economy in a way in which the analyst believes will not occur, then another variable must be chosen for the scenario. For a project that entailed the operation of a casino and gaming facility in the state, an investigation of several policy variables was undertaken. The variable "Amusement & Recreation", which could be used for a state with already established gaming facilities, could not be used in Illinois. That variable represents economic activity in Illinois that is not representative of the unique character of casinos.
A consulting firm was hired by the city of Chicago to analyse all aspects of building a gaming complex in the city. The consultants wanted to use the REMI model to find out the job creation impacts of this project. With information from the experience of New Jersey, the consultants chose several policy variables to reflect the operation of a gaming facility. Table 3 presents the group of variables that reflect the products and services that will be used in a gaming facility.
In addition to the demand changes in the economy for the operation of the facility, the consultants believed that the existence of casino gambling in the area would create specific additional economic activity. (See Table 4). Hotels and restaurants in the area would see an increase in business. However, the present amusement and recreation industry would experience lost sales since the casino would pull away their patrons. In addition, the consultants estimated the amount of lost revenue to pari-mutuel horse racing industry along with the local product substitution of some services, especially restaurants and apparel.
In this scenario, the analysts took into account both the impacts which would increase economic activity and also took account of the industries that would experience a reduction in business. Since most scenarios have both a benefit and cost side, it is important that the analyst investigate the complete impact of a policy change.
In the case of the Diamond Star discussed above, there were several concessions that state and local governments made to the company in exchange for locating in Bloomington, Illinois. The roads that were built to the factory gate, among other things, have to be paid by someone. If taxes were raised to meet these increased expenses, consumer purchasing power would be reduced, thereby reducing economic activity. The total impacts of the auto plant, estimated by REMI, would be dampened.
This aspect of including the costs as well as the benefits of a particular project is very important for two reasons. First of all, the integrity of the model is reduced if the impacts estimated are nowhere near the actual impacts that occur in the future. Secondly, the REMI analysis, instead of providing unbiased information, becomes a tool to market a policy that may not be beneficial to the group to which it is intended.
"SWITCHES" IN THE REMI MODEL
There are several switches that can be selected by the analyst to be used in the REMI model. Besides the obvious switches regarding real versus nominal dollars, there are others which relax economic assumptions. Economic theory states that, if wages increase, labor is attracted to those positions. In the REMI model, there is also migration of labor from outside the state as a result of increasing wages. However, in many states, or for many occupations, there is slack in the labor market and therefore, an increase in wages will attract existing labor in the state, without the need for migrants. The analyst is able to prevent the migration of labor into the state by using a switch.
As with the labor market example above, capital may not be fully utilised in the state at a point in time. It may be desirable to assume that investment remain constant as other economic activity occurs. The switch in the model will not alter investment as the optimal capital stock changes as a result of changing factor prices.
In the REMI model, government expenditures are a function of the population in the state or region. Any increase in population as a result of migration will call forth increased expenditures by government to serve these people. In this era of declining government services, it is likely that government services are spread across a larger population. Therefore, a switch is available to hold government expenditures constant in the face of changing population patterns.
Another useful switch for use with economies that are not at full employment, is the wage response switch. With the use of this switch, an increase the demand for labor or the increase in the amount of high-paying jobs in the local economy relative to the U.S. (called REO in the model), will not bid up wages. When one uses this switch, it is assumed that industry is able in hire more labor at the prevailing wage rate.
USING THE INPUT-OUTPUT TABLE FOR INCREASED PRECISION
Another feature of the REMI model is the inclusion of an input-output table that can be used if detailed information is available to use in a scenario. An input-output table displays the inter-industry transactions of the economy at a high level of disaggregation. These industry inter-actions only represent the economy at a moment in time and, therefore, cannot reflect changing supply and demand conditions over time. However, since the I-O table provides a high level of detail, its use in a scenario increases precision when used with the forecasting portion of the REMI model. An analysis that used the input-output table was a simulation that estimated the impact of lost coal sales on the state of Illinois that are expected as a result of the 1990 Clean Coal Act Amendments.
The coal industry has experienced fluctuations in economic activity since the 1970s. In that decade, the adoption of environmental laws, especially the federal Clean Air Act and subsequent amendments, led to changes in the Illinois coal market. The results of these environmental initiatives caused utilities which burned Illinois coal to seek alternative coal producers to meet these pollution requirements. For example, Commonwealth Edison, the state's largest utility, switched to low sulfur western U.S. coal to meet air quality standards for the northern area of the nation. Similarly, the northern coal markets for Illinois coal reduced purchases from Illinois mines and switched to the low sulfur coal of the western states. An additional impact on the Illinois coal market was due to the construction of nuclear plants in Illinois and around the country. Illinois has become the largest generator of electricity from nuclear plants. Coal-fired generation of electricity in Illinois has declined to just above forty percent of total electricity generation. In spite of these events, some new markets were developed due to growth in electricity demand in the southern states and the economics of transporting the Illinois coal to those areas.
To date, the Illinois coal industry has been able to adapt fairly well to the changes in economic and regulatory events. However, coal markets are expected to be altered dramatically once again. The passage of the 1990 Clean Air Act Amendments is expected to cause a significant decline in Illinois coal sales since it requires that electric utilities make large sulfur dioxide emission reductions by 1995 and then again in 2000.
To meet the requirements of the Act, a utility principally has two choices: installing scrubbers and using high-sulfur coal, such as Illinois coal or switching to low-sulfur western coal. Since there is a strong possibility that the utilities which presently burn Illinois coal will alter their present policy, the REMI Model was used to determine the impacts of switching on the state's economy. Of particular interest are the impacts on employment and personal income of the coal mining areas. Furthermore, the loss of non-mining jobs in the areas was also investigated with the REMI model.
The first step in this impact analysis was to develop the input variables to be used in the sub-state REMI model. The mining industry sales variable could be used to simulate the effects of lost coal sales. Using this variable, however, assumes that the coal mining industry purchases the same goods and services as the mining industry. The mining industry is the several sub-categories, including coal mining, petroleum and natural gas extraction, stone and clay mining, among others. Therefore, use of a policy variable (i.e. the mining industry) reflecting the average of all the smaller industries cannot be as precise as using a sub-category, such as the coal mining industry, with its specific purchases of excavation and earth-moving equipment. Since input data had been compiled at the more detailed level of the coal mining industry level, the input-output variable was used to provide increased accuracy in the impacts expected in the economy.
Coal sales in tons were placed into four risk categories based on several factors, such as the type of contract, the ability of the utility to scrub, and the announced plans of the utility regarding its policy on the Clean Air Act. Coal sales were assigned to one of the following categories:
|
Ninety percent of Illinois coal sales are to electric utilities. While the remaining amount of coal sales to the industrial and retail markets can also be classified into one of the risk categories, this analysis concentrates on coal sales to utilities.
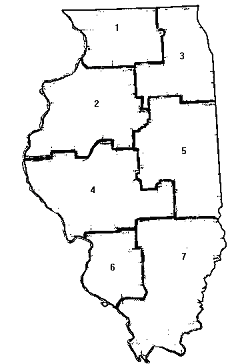
A description of the sub-state REMI model regions is necessary at this juncture to illustrate the major coal-producing areas. The sub-state REMI model is divided into seven regions of the state: northeast (1), east (2), central west and east (4 and 5), and southwest and south (6 and 7). The remaining region, number 3, represents the Chicago area including the suburban counties. The majority of production is located in two southern REMI regions (6 and 7) of the sub-state model. Three other regions of the REMI model, the central areas and the east, also produce coal.
FIGURE 6
Illinois REMI Regions
Illinois coal is presently mined in nineteen counties, located predominantly in the southern portion of the state. Although coal mining represents a small percentage of gross state product, for some counties in the state, coal mining represents a significant amount of their regional product and provides a principal source of employment in the areas, as indicated in Table 5. Therefore, increased precision is an important factor in this analysis.
Coal output, sold to utilities, from the southwest (region 6) and the south (region 7), each constitute 43.3 percent of total utility purchases. The remaining REMI regions (2, 4, and 5) combined represent 13.4 percent of Illinois coal sales to utilities. Table 6 presents the amount of tons at risk by county and REMI region. Focusing on county data, one notices that certain counties have a large portion of coal sales to utilities in the two riskiest categories: for example, Christian (90%), Franklin (90%), Gallatin (84%). While all southern Illinois counties are heavily reliant on the coal industry for economic growth, a county such as Gallatin, with a large amount of coal sales and 25 percent of its personal income derived from mining, would be devastated if coal sales plummeted. On the REMI regional level, region 6 and 7, both significant coal regions, have 51.5 and 67.9 percent of coal sales in the two riskiest categories.
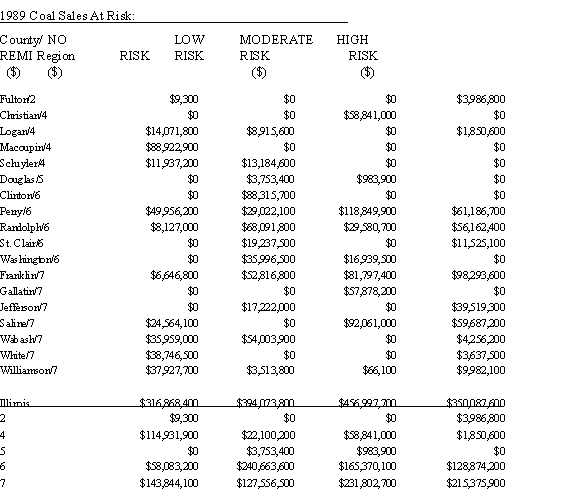
In Table 7, the tonnages of the risk categories are converted to dollar amounts using the average price for Illinois coal. These dollar amounts represent the value of potential lost coal output in the regions of the state and it is these amounts that were used as the inputs to the REMI model. Since these inputs represent a higher level of disaggregation than the two-digit SIC mining category, the input-output portion of the model was stimulated with these data.
TABLE 5
1989 Employment and Personal Income of Coal-Producing Counties.
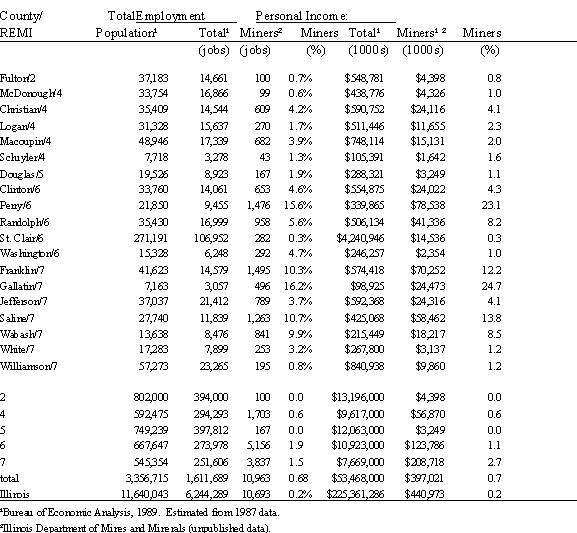
TABLE 6
County Coal Production, Coal Sales to Utilities, and Degree of Risk.
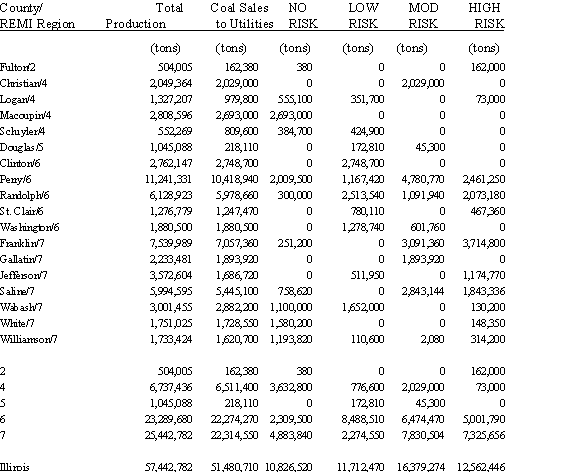
TABLE 7
Coal Sales at Risk.
REGIONAL ASPECTS OF COAL OUTPUT LOSSES
Two scenarios were created regarding the impact of lost coal sales on the regions of Illinois. The low case scenario represents the highest probability of lost coal sales: the high risk category. The combined sales losses of the high risk and the moderate risk would be a worse occurrence for these regions and so was considered the high case scenario. Results of this analysis indicate that between 13,000 and 31,000 Illinois jobs (0.2% to 0.5% of statewide employment) are at risk under the low case and high case scenarios as indicated in Table 8. Coal job losses in REMI region 6 and 7 are over 25 percent of total job losses in those regions, while are much smaller in the remaining three regions. For the state as a whole, coal job losses represent 16 and 21 percent of all job losses for the low case and high case scenarios, respectively. However, as mentioned earlier, for many counties in REMI regions 6 and 7, the job losses in individual counties as a percent of total county job losses would be much more significant in both the low case and high case scenarios. Mining employment losses strongly affect other types of employment in the regions. For example, 70 percent of the job losses in REMI regions 6 and 7 occur in non-mining sectors, the majority of losses originating in retail, wholesale, and services. Table 9 presents lost personal income in the REMI regions for both the low and high case scenarios. For the state as a whole, lost income in the mining industry represents 16 percent of all lost income. Lost income for the mining industry reaches 29 percent of total lost personal income in REMI region 6, while remains less significant in the other regions. Significant personal income losses therefore, also occur in non-mining sectors of the economy. The general conclusion would be that, while the job and income losses are a small percentage of total Illinois employment and personal income, the REMI regions and especially the counties of southern Illinois, would experience large employment and income losses.
TABLE 8
1995 Employment Forecast - Low and High Case Impacts.
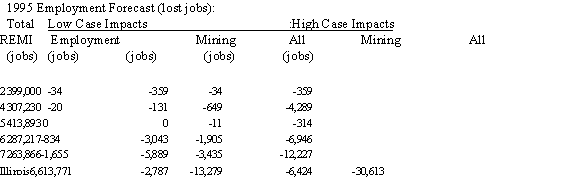
A few interesting results occurred in the REMI regions when the coal output scenario losses were run. In region 2, the number of lost jobs in the durable goods manufacturing sector (-59) appeared to be much too large for the $4 million reduction in coal output. What was occurring was that, as coal output declined in the other regions of the state, the demand for earth-moving equipment (and other durable equipment used in mining), declined. Both John Deere and Caterpillar, two major producers of this type of equipment, are located in REMI region 2 and responded to a decline in demand for their products with layoffs.
TABLE 9
1995 Personal Income Forecast - Low and High Case Impacts.
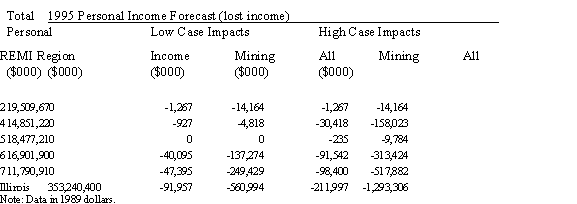
With regards to the east central region, REMI region 5, service industry personnel increased when the only stimulation that this region received, was negative. Region 5 gained jobs in services counter to intuitive economic theory. This phenomenon is a result of agglomeration economies. If an area's economic activity declines, it may not able to support certain services and may have "to import" certain services from adjacent regions. The large declines in economic activity in the south and southeast areas of Illinois (REMI regions 6 and 7) meant that those communities were forced to receive many services from east central Illinois (REMI region 5). The significance of these occurrences indicates the strong inter-regional and inter-industry links that are built into the model.
CONCLUSION
The REMI model is a complex and dynamic model of the economy that can be used for several types of analysis. The above discussion provided an overview of many of the aspects of the model that are available to the user. While there are both more details than presented here and more uses available to the analyst than discussed here, this overview provides some essential information about the workings of the model for a user.
REFERENCES
1. Ill. Dept. of Energy & Natural Resources, Outlook for the Illinois Coal Industry: 1995-2000, ILENR/CD-91/03, Springfield, Ill., November, 1991.
2. Ill. Dept. of Energy & Natural Resources, Outlook for the Illinois Coal Industry, ILENR/CD-92/01, Springfield, Ill., March, 1992.
3. Regional Economic Models, Inc., Model Documentation, Volume 1, Amherst, Mass., May, 1991.
4. Treyz, George I., D.S. Rickman, and G. Shao, "The REMI Economic-Demographic Forecasting and Simulation Model", International Regional Science Review. forthcoming.
ACKNOWLEDGMENTS
The author would like to thank Gary Philo of the department's Coal Demonstration Section, who provided tables and coal industry information and Michael A. Scott of the department's Strategic Planning Section, who provided computer expertise.